
Western Economic Diversification Canada’s Quarterly Financial Report for the quarter ended June 30, 2019
View the print-friendly version: PDF
Statement Outlining Results, Risks and Significant Changes in Operations, Personnel and Programs
Introduction
This quarterly financial report should be read in conjunction with the Main Estimates. It has been prepared by management as required by section 65.1 of the Financial Administration Act (FAA) and in the form and manner prescribed by the Treasury Board. This quarterly report has not been subject to an external audit or review.
Authority, Mandate and Program Activities
Western Economic Diversification Canada (WD) is mandated to "promote the development and diversification of the economy of Western Canada and to advance the interests of the West in national economic policy, program and project development and implementation."
The Departmental Plan and Main Estimates provide further information on WD's authority, mandate and program activities.
Basis of Presentation
This quarterly report has been prepared by management using an expenditure basis of accounting. The accompanying Statement of Authorities includes the department's spending authorities granted by Parliament and those used by the department, consistent with the Main Estimates for the 2019-2020 fiscal year. This quarterly report has been prepared using a special purpose financial reporting framework designed to meet financial information needs with respect to the use of spending authorities.
The authority of Parliament is required before money can be spent by the Government. Approvals are given in the form of annually approved limits through appropriation acts, or through legislation in the form of statutory spending authority for specific purposes.
The Department uses the full accrual method of accounting to prepare and present its annual departmental financial statements that are part of the departmental results reporting process. However, the spending authorities voted by Parliament remain on an expenditure basis.
Financial Structure
WD manages its expenditures under two votes:
- Vote 1 – Net operating expenditures include salary, and other operating costs (e.g., transportation and communications; professional and special services).
- Vote 5 – Grants and contributions include all transfer payments.
Budgetary statutory authorities represent payments made under legislation approved by Parliament, and include items such as the Government of Canada's share of employee benefit plans and other minor items.
Highlights of Fiscal Quarter and Fiscal Year-to-Date (YTD) Results
The following section highlights significant changes to fiscal quarter results as of of June 30, 2019.
Statement of Authorities: Vote 1 – Net Operating Expenditures
Total authorities available for use for fiscal year 2019-2020 are $42.1 million, a net increase of $6.1 million, or 17%, compared to the $36.0 million for 2018-2019. The net increase is explained by:
- $3.0 million increase to deliver programming for investing in a diverse and growing Western economy;
- $1.1 million increase to deliver the Innovation and Skills Plan;
- $1.0 million increase for protecting water and soil in the prairies;
- $0.6 million increase for the salary allocations of the new collective bargaining agreements;
- $0.3 million increase to deliver the Women Entrepreneurship Strategy;
- $0.2 million increase to deliver the Canada Coal Transition Initiative;
- $0.1 million increase for launching a federal strategy on jobs and tourism, and
- $0.2 million net decrease from other minor adjustments.
Total authorities used has increased to $9.6 million for the quarter ended June 30, 2019, compared to $8.5 million June 30, 2018. Salaries increased in 2019 to deliver WD's transfer payment programs. Timing differences in ongoing expenses account for the remainder of increase.
Graph 1 illustrates total authorities available for use for the fiscal year, and authorities used at quarter-end.
(in thousands of dollars)
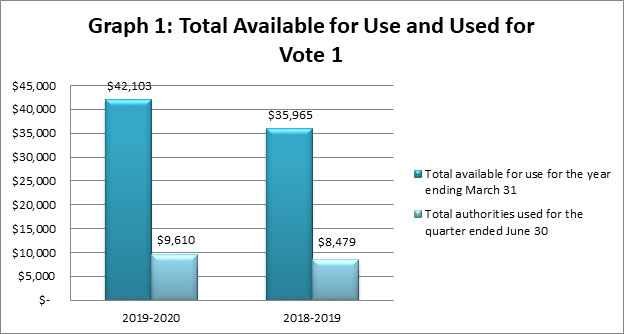
Total Available for Use and Used for Vote 1 (in thousands of dollars)
This bar graph breaks down total authorities available for use for fiscal year 2019-20 and the authorities used at quarter end and then compares them to fiscal year 2018-19.
2019-2020
- $42,103 represents total available for use for the year ending March 31
- $9,610 represents total authorities used for the quarter ending June 30
2018-2019
- $35,965 represents total available for use for the year ending March 31
- $8,479 represents total authorities used for the quarter ending June 30
Statement of Authorities: Vote 5 – Grants and Contributions
Total authorities available for use for fiscal year 2019-2020 are $258.1 million, a net increase of $148.3 million, or 135%, compared to the $109.8 million for 2018-2019. The net increase is explained by:
- $29.3 million increase for investing in a diverse and growing Western economy;
- $25.0 million increase in funding to support small and medium-sized enterprise users of steel and aluminum;
- $24.3 million increase to restore rail service to Churchill, Manitoba;
- $23.5 million increase to fund the Innovation and Skills Plan;
- $15.8 million increase to reinvest receipts from repayable contributions;
- $6.2 million increase to fund the Women Entrepreneurship Strategy;
- $5.9 million increase for the Rick Hansen Institute;
- $5.0 million increase to fund Manitoba's aerospace sector;
- $5.0 million increase in funding from the conclusion of WD's commitment towards the thirty meter telescope;
- $4.9 million increase to fund the Canada Coal Transition Initiative; and
- $3.4 million increase for launching a federal strategy on jobs and tourism.
Total authorities used for the quarter-ended June 30, 2019 increased to $27.2 million, compared to $20.0 million at June 30, 2018. The $7.2 million increase, or 36%, is explained by:
- $4.8 million increase in Western Diversification Program payments, investing in a diverse and growing economy;
- $4.3 million increase to restore rail service to Churchill, Manitoba; and
- $1.9 million decrease for timing differences for various WD programs.
Graph 2 illustrates total authorities available for use for the fiscal year, and authorities used at quarter-end.
(in thousands of dollars)
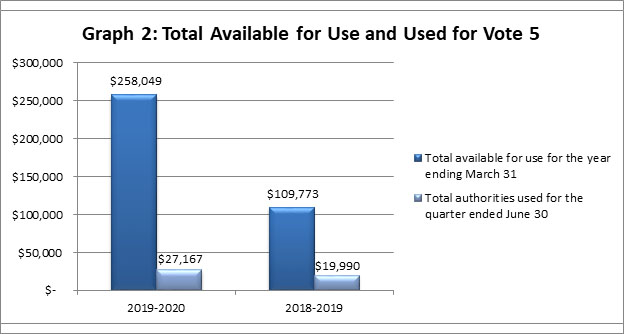
Total Available for Use and Used for Vote 5 (in thousands of dollars)
This bar graph breaks down total authorities available for use for fiscal year 2019-20 and the authorities used at quarter end and then compares them to fiscal year 2018-19.
2019-2020
- $258,049 represents total available for use for the year ending March 31
- $27,167 represents total authorities used for the quarter ending June 30
2018-2019
- $109,773 represents total available for use for the year ending March 31
- $19,990 represents total authorities used for the quarter ending June 30
Statement of Authorities: Budgetary Statutory Authorities
Budgetary statutory authorities available for use for fiscal year 2019-2020 changed to $4.8 million, an increase of $1.0 million when compared to the $3.8 million in 2018-2019. The increase is a result of additional salary funding provided through Budget 2018 and Budget 2019 announcements and to incorporate additional funding as the employee benefit plan rate increased to 27%.
There is a slight increase in budgetary statutory authorities used for this reporting period when compared to the previous fiscal year.
Graph 3 illustrates total authorities available for use for the fiscal year, and authorities used at quarter-end.
(in thousands of dollars)
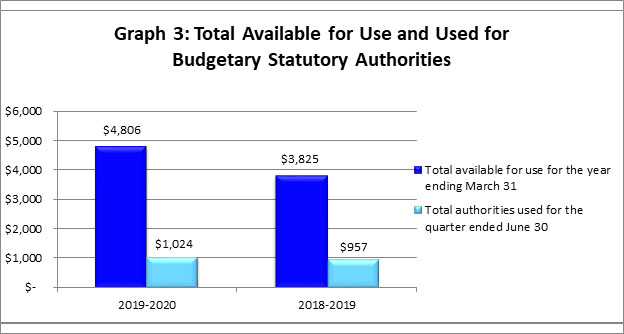
Total Available for Use and Used for Budgetary Statutory Authorities (in thousands of dollars)
This bar graph breaks down total authorities available for use for fiscal year 2019-20 and the authorities used at quarter end and then compares them to fiscal year 2018-19.
2019-2020
- $4,806 represents total available for use for the year ending March 31
- $1,024 represents total authorities used for the quarter ending June 30
2018-2019
- $3,825 represents total available for use for the year ending March 31
- $957 represents total authorities used for the quarter ending June 30
Statement of the Departmental Budgetary Expenditures by Standard Object
Expenditures by standard object for the quarter ended June 30, 2019, were $37.8 million, which reflects an increase of $8.4 million, or 29%, from the $29.4 million at June 30, 2018. The variance is due to investing in a diverse and growing Western economy by increases in salary payments, increases for payments under the Western Diversification Program and to maintain rail service to Churchill, Manitoba, and timing differences in the processing of claims for reimbursement under various other transfer payment programs. Additional information can be found in the Statement of Authorities, Vote 1 and Vote 5 sections above.
Graphs 4 and 5 illustrate actual expenditures for the quarter-end.
(in thousands of dollars)
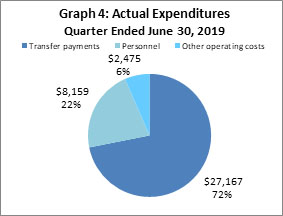
Actual Expenditures Quarter Ended june 30, 2019 (in thousands of dollars)
This pie chart breaks down actual expenditures for quarter ended June 30, 2019.
- $27,167 represents actual spending on Transfer Payments, which accounts for 72% of Actual Expenditures quarter ended June 30, 2019
- $8,159 represents actual spending on Personnel, which accounts for 22% of Actual Expenditures quarter ended June 30, 2019
- $2,475 represents actual spending on Other operating costs, which accounts for 6% of Actual Expenditures quarter ended June 30, 2019
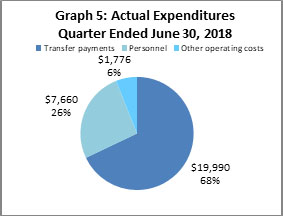
Actual Expenditures Quarter Ended June 30, 2018 (in thousands of dollars)
This pie chart breaks down actual expenditures for the quarter ended June 30, 2018.
- $19,990 represents actual spending on Transfer Payments, which accounts for 68% of Actual Expenditures quarter ended June 30, 2018
- $7,660 represents actual spending on Personnel, which accounts for 26% of Actual Expenditures quarter ended June 30, 2018
- $1,776 represents actual spending on Other operating costs, which accounts for 6% of Actual Expenditures quarter ended June 30, 2018
Risks and Uncertainties
The department is managing the allocation of resources within a well-defined framework of accountabilities, policies and procedures including a system of budgets, reporting and other internal controls to manage within available resources and Parliamentary authorities. WD also conducts an annual risk assessment exercise as part of its overall risk management approach. WD has not identified any significant financial risks from their annual risk assessment.
The department maintains financial management processes to ensure effective budget management. Processes are in place to assess the impact of project timing fluctuations and the process for forecasting multi-year funding requirements. The decision-making process facilitates the re-allocation of financial resources to priority initiatives.
Significant Changes in Relation to Operations, Personnel and Programs
There are no significant changes in relation to operations, personnel and programs for this reporting period.
Approval by Senior Officials
Approved by:
Original signed by:
________________________
Dylan Jones
Deputy Minister
Edmonton, Canada
Date: August 12, 2019
Original signed by:
________________________
Cathy McLean
Chief Financial Officer
Statement of Authorities (unaudited)
Fiscal year 2019-2020 (in thousands of dollars)
| Authorities | Total available for use for the year ending March 31, 2020* | Used during the quarter ended June 30, 2019 | Year-to-date used at quarter-end |
|---|---|---|---|
| Vote 1 - Net operating expenditures | $ 42,103 | $ 9,610 | $ 9,610 |
| Vote 5 - Grants and contributions | 258,049 | 27,167 | 27,167 |
| Budgetary statutory authorities | 4,806 | 1,024 | 1,024 |
| Total authorities | $ 304,958 | $ 37,801 | $ 37,801 |
Fiscal year 2018-2019 (in thousands of dollars)
| Authorities | Total available for use for the year ending March 31, 2019* | Used during the quarter ended June 30, 2018 | Year-to-date used at quarter-end |
|---|---|---|---|
| Vote 1 - Net operating expenditures | $ 35,965 | $ 8,479 | $ 8,479 |
| Vote 5 - Grants and contributions | 109,773 | 19,990 | 19,990 |
| Budgetary statutory authorities | 3,825 | 957 | 957 |
| Total authorities | $ 149,563 | $ 29,426 | $ 29,426 |
*Includes only Authorities available for use and granted by Parliament at quarter-end.
Departmental Budgetary Expenditures by Standard Object (unaudited)
Fiscal year 2019-2020 (in thousands of dollars)
| Expenditures | Planned expenditures for the year ending March 31, 2020* | Expended during the quarter ended June 30, 2019 | Year-to-date used at quarter-end |
|---|---|---|---|
| Personnel | $34,207 | $8,159 | $8,159 |
| Transportation and communications | 2,630 | 276 | 276 |
| Information | 351 | 48 | 48 |
| Professional and special services | 6,761 | 1,884 | 1,884 |
| Rentals | 1,010 | 185 | 185 |
| Repair and maintenance | 822 | 0 | 0 |
| Utilities, materials and supplies | 160 | 23 | 23 |
|
Acquisition of machinery and equipment |
968 | 12 | 12 |
| Transfer payments | 258,049 | 27,167 | 27,167 |
| Other subsidies and payments | 0 | 47 | 47 |
| Total net budgetary expenditures | $304,958 | 37,801 | 37,801 |
Departmental Budgetary Expenditures by Standard Object (unaudited)
Fiscal year 2018-2019 (in thousands of dollars)
| Expenditures | Planned expenditures for the year ending March 31, 2019* | Expended during the quarter ended June 30, 2018 | Year-to-date used at quarter-end |
|---|---|---|---|
| Personnel | $28,990 | $7,660 | $7,660 |
| Transportation and communications | 1,611 | 249 | 249 |
| Information | 301 | 37 | 37 |
| Professional and special services | 6,772 | 1,098 | 1,098 |
| Rentals | 893 | 156 | 156 |
| Repair and maintenance | 430 | - | - |
| Utilities, materials and supplies | 121 | 10 | 10 |
| Acquisition of machinery and equipment | 672 | 30 | 30 |
| Transfer payments | 109,773 | 19,990 | 19,990 |
| Other subsidies and payments | - | 196 | 196 |
| Total net budgetary expenditures | $149,563 | $29,426 | $29,426 |
*Includes only Authorities available for use and granted by Parliament at quarter-end.
- Date modified: