
2016-2017 Departmental Results Report
ISSN 2561-0996
View the print-friendly version: PDF
Table of contents
- Minister’s message
- Results at a glance
- Raison d’être, mandate and role: who we are and what we do
- Operating context and key risks
- Results: what we achieved
- Analysis of trends in spending and human resources
- Supplementary information
- Appendix: definitions
Minister's Message
I am pleased to report progress made on making Canada a world-leading centre for innovation and science, helping create good, well-paying jobs, and strengthening and growing the middle class.
The work of the Innovation, Science and Economic Development Portfolio includes promoting innovation and science; supporting the commercialization of more research and ideas; providing more Canadians with the skills to participate in a global and digital economy; helping small businesses grow through innovation, access to capital and trade; promoting increased tourism in Canada; and supporting scientific research and the integration of scientific considerations in our investment and policy choices.
This year, the Portfolio organizations continued their work to deliver on the Government’s Budget 2017 commitment to develop an Innovation and Skills Plan. The plan’s focus on people and addressing the changing nature of the economy is a focus for the Portfolio’s programs.
WD continued to develop and diversify the western Canadian economy through the delivery of its investment programs, services, and convening activities. This has helped businesses become more innovative and competitive. The department also supported regional and community economic development opportunities, including those that involved Indigenous peoples and other underrepresented groups.
It is my pleasure to present the 2016–17 Departmental Results Report for Western Economic Diversification Canada.

The Honourable Navdeep Bains
Minister of Innovation, Science
and Economic Development
Results at a glance
| What funds were used? (2016–17 Actual Spending) |
Who was involved? (2016–17 Actual Full-Time Equivalents [FTEs]) |
|---|---|
| $190,483,274 | 292 |
- Based on the latest available data from Statistics Canada, western Canadian firms that accessed lending services through the WD-funded Community Futures (CF) program increased their sales by 11.2 percent and grew their employment by 8.0 percent annually, compared to non-CF clients whose sales increased by 6.2 percent and whose employment grew by 2.9 percent annually from 2009 to 2014.1:ftnref1
- In 2016-17, WD conducted a pilot project to determine the impact of the Women’s Enterprise Initiative (WEI) using Statistics Canada data. The results showed that between 2007 to 2012, western Canadian women-owned firms that accessed lending services through the WD-funded WEI program increased their sales by 10.6 percent and their employment growth by 5.7 percent annually, compared to non-WEI clients whose sales increased by 1.2 percent and employment by a negative 0.25 percent per year during the same period.2:ftnref2
- WD invested $24.1 million in 55 clean technology projects to support the Budget 2016 commitment to double the regional development agencies’ aggregate investments in clean technology to $100 million and in support of Government of Canada’s Innovation and Skills Plan.
- WD-assisted projects reported $680 million in international business activity facilitated by the department in support of Government of Canada’s Trade and Investment priority.
- Under the Canada 150 Community Infrastructure Program, WD approved 320 projects for $46.2 million to support the renovation, expansion and improvements of existing community infrastructures as part of the Government of Canada's 150th anniversary celebration of Confederation.
- In May 2016, the Fort McMurray wildfire drove 90,000 people from their homes and impacted Alberta’s largest industry—the oil and gas sector. WD played a lead federal role in recovery and rebuilding of Fort McMurray which involved working with numerous federal departments, the Government of Alberta, Regional Municipality of Wood Buffalo, and Canadian Red Cross to coordinate the federal response and ensure effective collaboration with provincial and local governments.
For more information on the department’s plans, priorities and results achieved, see the “Results: what we achieved” section of this report.
__________
Raison d’être, mandate and role: who we are and what we do
Raison d’être
Western Economic Diversification Canada (WD) was established in 1987 to promote the development and diversification of the economy of Western Canada and to advance the interests of the West in national economic policy, program and project development and implementation. The Minister of Innovation, Science and Economic Development is responsible for this organization.
Mandate and role
WD's mandate, derived from the Western Economic Diversification Act, is to grow and diversify the western Canadian economy. This broad mandate allows the department to implement diverse initiatives across the West and make strategic investments that build on regional competitive advantages.
Our Vision
To be a leader in creating a more diversified western Canadian economy that has growing, competitive and innovative businesses and communities.
WD has offices in each western Canadian province, as well as an office in Ottawa. Its western base enables the department to foster relationships across Western Canada with business and community organizations, research and academic institutions, Indigenous groups, as well as provincial and municipal governments. These connections assist the department to identify and support economic opportunities in the West and to leverage its investments to benefit the western Canadian economy.
In addition, through its connections with other federal departments, WD ensures that western interests and perspectives are reflected in national policy development and decision making.
WD works to build on the West's traditional economic strengths while supporting the transition to a more diverse economy to ensure prosperity for western Canada.
WD focuses its activities in three program areas:
Business Development and Innovation: WD helps small and medium-sized enterprises (SMEs) grow, create jobs, expand their markets, increase their exports and become more innovative and productive. The department assists SMEs with international business activities and works to attract investment to the region, as well as assist western Canadian SMEs to access opportunities linked to government procurement. Further, WD promotes the development and growth of the knowledge-based economy by building innovation capacity and supporting the commercialization of new knowledge-based products, processes and services.
Community Economic Growth: WD helps communities sustain their local economies and adjust to changing economic circumstances through departmental programs and by delivering national initiatives on behalf of the Government of Canada in Western Canada. WD also supports community-based organizations that provide western entrepreneurs with the information, training and loans they need to start and grow their businesses.
Policy, Advocacy and Coordination: WD identifies opportunities to strengthen the western Canadian economy and coordinate economic development activities, policies and programs across the West. WD builds strategic relationships with key decision makers across Canada and works with western Canadian industry on defence-related procurement opportunities.
WD supports regional economic diversification and inclusive growth through investment in projects under the Western Diversification Program (WDP) in areas of innovation; business growth; community economic growth; and through policy, advocacy and coordination. The WDP provides funding to not-for-profit organizations for projects directly supporting one (or more) of the four departmental priorities, as presented in WD's 2016–17 Report on Plans and Priorities. Under the WDP, through the Western Innovation (WINN) Initiative, WD provides repayable contributions to SMEs to support the commercialization of knowledge-based products, services and processes. WINN has been an important tool in helping western SMEs to accelerate the commercialization of clean technologies and stimulate greater private sector investment.
WD programming contributes to the following Government of Canada priorities:
- Innovation and Skills;
- Trade and Investment;
- Indigenous Peoples; and
- Infrastructure.
In addition, WD supports the Western Canada Business Service Network (WCBSN), which is a network of over 100 independent organizations providing business services to foster inclusive sustainable growth of small businesses across the West. The WCBSN network includes the Canada Business Network (CBN), Community Futures, Women's Enterprise Initiative, Francophone Economic Development Organizations, Indigenous Business Development Services, and Entrepreneurs with Disabilities.
Further, WD serves western Canadian stakeholders by delivering national initiatives on behalf of the federal government in Western Canada. These include the Canada 150 Community Infrastructure Program to renovate, expand, and improve existing community infrastructures, the Strategic Partnerships Initiative that coordinates the Government of Canada’s investments across a range of departments to boost Indigenous participation in economic development opportunities, as well as the Economic Development Initiative that supports economic development in western Canadian Francophone communities.
For more general information about the department, see the "Supplementary information - internal link" section of this report. For more information on the department's organizational mandate letter commitments, see the Minister’s mandate letter.
Operating Context and Key Risks
Operating context
Western Canada accounted for 37 percent of Canada's real Gross Domestic Product (GDP) in 2016.3 The region led the country in economic growth from 2011 to 2014, before posting small declines in both 2015 (-0.8%) and 2016 (-0.5%). Low oil and other natural resource prices resulted in sharply different outcomes for the western provinces over the past two years. British Columbia and Manitoba continued to experience above-average growth, but this was offset by recessions in Alberta and Saskatchewan. Looking forward, stabilizing energy prices should see oil and gas activity start to recover, which along with growth in other sectors, such as manufacturing and commercial services, should result in positive economic growth for all four western provinces in 2017.4
Western Economic Diversification Canada (WD) supports the Government of Canada's key priorities identified in the Ministers' mandate letters and in federal budgets. These priorities include implementing Canada's Innovation and Skills Plan, accelerating clean growth through investments in clean technologies, and assisting firms with high-growth potential to scale up through the Accelerated Growth Service. Other initiatives include the Canada 150 Community Infrastructure Program and promoting economic growth for Indigenous Peoples.
Economic success will require building on regional strengths. Progress is being made towards growing the Western Canada's clean technology sector, along with other innovation based industries such as information and communication technology, natural resources, aerospace, life sciences and value-added agriculture. There is also a higher proportion of high-growth small and medium-sized enterprises (10.1 percent) in Western Canada than in the rest of Canada (8.8 percent), led by Alberta and Saskatchewan. Sustained development of these firms will contribute to the success of the western Canadian economy.
Key risks
In its 2016–17 Report on Plans and Priorities, WD identified two key risks: competitiveness and productivity challenges, and a small domestic market and increasing global competition.
Businesses in Western Canada face a number of competitiveness and productivity challenges, such as comparatively low levels of business investment in research and development and slower adoption of new technologies and equipment.5, 6 This is partly due to low levels of risk capital financing in Western Canada. Innovative start-up firms face greater challenges in accessing sufficient financing for technology commercialization priorities; this funding gap is particularly pronounced for early-stage firms.
Western Canadian businesses also face the challenge of a small domestic market and increasing global competition. Expanding international market opportunities for western Canadian businesses is an important component of economic prosperity. In order to remain competitive in a global economy, western Canadian businesses will need to increase their presence in international markets, participate in global value chains, and attract foreign direct investment.
The following table highlights the response strategies taken by the department in 2016–17 to address these risks.
Key risks
| Risks | Mitigation strategy and effectiveness | Link to the department's Program(s) | Link to mandate letter commitments or to government-wide and departmental priorities |
|---|---|---|---|
| Weak competitiveness and low productivity in Western Canada (existing risk) |
|
Business Development and Innovation |
|
| Small domestic market and increasing global competition for western Canadian businesses (existing risk) |
|
Business Development and Innovation |
|
__________
Results: what we achieved
Programs
Western Economic Diversification Canada (WD) works to grow the western Canadian economy by helping to build businesses that are productive, innovative and export-oriented, while diversifying the base of the western Canadian economy.
In 2016–17, WD's mandate was advanced through three programs:
- Business Development and Innovation;
- Community Economic Growth; and
- Policy, Advocacy and Coordination.
WD sets targets annually for all performance indicators at the program and sub-program level in the departmental performance measurement framework (PMF). Progress is tracked against targets based primarily upon results that grants and contributions multi-year projects report during the fiscal year. In addition, WD collects information on several non-PMF performance indicators to support accountability and programming decision making.
Program 1.1: Business Development and Innovation
Description
Business Development and Innovation supports western Canadian businesses, industry, and research organizations to enhance business innovation, productivity, and global engagement. Value-added production is strengthened through the introduction of new products, technologies, or innovations to existing processes, as well as through efforts to pursue global markets and increase investment in Western Canada. Additionally, this program supports some members of the Western Canada Business Service Network and related partners to provide business services and access to capital in Western Canada in support of increased entrepreneurism. Transfer payments in support of this program are made under the authority of the Women's Enterprise Initiative and the Western Diversification Program. Funding support of the Canada Business Network is comprised of operations and maintenance funding.
Results
WD tracks three indicators to capture the impact of the Business Development and Innovation program:
- value of international business activity facilitated by WD;
- number of small and medium-sized enterprises (SME) that increase gross margins; and
- number of instances of protection of intellectual property exercised.
WD met or exceeded its targets for two of the three program performance indicators (see Performance Results table on page 12).
The target for value of international business activity facilitated by WD was $392 million and the actual result was $680 million. The target for the number of SMEs that increase their gross margins was 18 and the actual result was 20. For these two indicators, the variance is due to the multi-year nature of the projects funded with results sometimes being realised or reported earlier than anticipated.
In 2016-17, WD funded projects reported
- 1,342 jobs created [7]
- $13.6 million in value of business expenditures on research & development [8], and
- $66 million of sales tied to knowledge-based products, processes, services or technologies being commercialized in support of the Government of Canada Innovation & Skills Plan
The target for the remaining indicator, which captures the number of instances of protection of intellectual property exercised, was 26 and the actual result was 13. The variance for this indicator is attributable to a small number of projects that are taking longer than anticipated to produce results.
WD invested $24.1 million in 55 clean technology projects in support of the Budget 2016 commitment to double the Regional Development Agencies’ aggregate investments in clean technology to $100 million. WD’s areas of investment include growing clean technology companies, greening industry, greening communities, and capacity building.
WD also approved $56.4 million in multi-year assistance for 45 Business Development and Innovation projects to commercialize new innovative products, processes and services; enhance exports to new international markets; and attract investment to Western Canada. The projects are strengthening regional clusters in the areas of clean technology, information communication technologies, health and life sciences, and value-added manufacturing.
In October 2016, WD supported the Foreign Direct Investment Canada Forum in Calgary. This forum promoted Western Canada as a destination of choice for foreign direct investment to potential international investors. It profiled potential business opportunities and hosted speakers to help investors understand the best areas for investment in Western Canada. This forum led to $25 million in international business activity facilitated by WD.
WD also supported the BC Export Assistance Project, which enables SMEs to become successful, profitable exporters. With funding from the Province of British Columbia, WD and Small Business BC, this initiative offers SMEs access to community-based export specialists who identify the specific needs and export readiness of participating businesses and offer a tailored export approach. To date, this initiative has assisted 61 participants across a variety of sectors including agrifood, manufacturing, and consumer goods.
WD completed refocusing the Indigenous Business Development Services (formerly known as the Aboriginal Business Services Network). This involved implementing a more targeted approach to support early stage entrepreneurship for new and existing Indigenous entrepreneurs and business organizations in Western Canada.
Under the overall Government of Canada theme of experimentation and innovation, WD conducted a pilot project to test the Community Futures (CF) program loans impact assessment methodology on smaller-scale Women's Enterprise Initiative (WEI). WEI provides loans to support women entrepreneurs to start and expand their businesses. The study was based on the latest available Statistics Canada data from 2007 to 2012 and compared the business performance of WEI women-owned business loan clients to similarly-sized, women-owned incorporated companies in Western Canada. The study found the following results[9] :
- Employment Growth: WEI-assisted firms grew at a compounded rate of 5.76 percent per year compared to a negative growth rate of 0.25 percent for non-assisted firms.
- Sales Growth: WEI-assisted firms grew at a compounded rate of 10.67 percent per year compared to 1.21 percent for non-assisted firms.
- Firm Longevity: WEI-assisted firms also exhibited stronger firm longevity than firms in the comparable group, especially in the long run. There was a 60.24 percent survival rate after five years for WEI-assisted businesses versus 45.26 percent for non-assisted firms.
WD commenced an evaluation of its innovation programming in 2016-17. The findings and recommendations from the innovation evaluation will be reported in next year’s departmental results report. WD also identified key lessons learned on the WINN call-for-proposals (CFP) process which include enhancing the timeliness of the intake process in terms of predictability, increasing the proposal submission period between call for proposals and proposals closing, and providing greater feedback to the unsuccessful applicants. WD will consider these recommendations as part of the WINN review currently underway.
Results achieved
| Expected results | Performance indicators | Target | Date to achieve target | 2016–17 Actual results | 2015–16 Actual results | 2014–15 Actual results |
|---|---|---|---|---|---|---|
| Western Canadian small and medium-enterprises (SMEs) are engaged in international business | Value of international business activity facilitated by WD | $392M | March 31, 2017 | $680M | $550M | $72.8M |
| Western Canadian SMEs are competitive | Number of SMEs that increase gross margins | 18 | March 31, 2017 | 20 | 10 | 25 |
| Western Canadian SMEs are innovative | Number of instances of protection of intellectual property exercised | 26 | March 31, 2017 | 13 | 9 | 24 |
Note: Not all WD projects report on these indicators and overall results are therefore understated. WD is in the process of revising its reporting framework to allow better reporting in the future. Results are based on active projects reporting during the fiscal year and are not cumulative from previous year(s). Consequently, trends analysis would not be an accurate way to assess these results.
Budgetary financial resources (dollars)
| 2016-17 Main Estimates | 2016-17 Planned spending | 2016-17 Total authorities available for use | 2016-17 Actual spending (authorities used) | 2016-17 Difference (actual minus planned) |
|---|---|---|---|---|
| 95,135,450 | 95,135,450 | 97,106,096 | 96,821,013 | 1,685,563 |
Human resources (full-time equivalents)
| 2016–17 Planned | 2016–17 Actual | 2016–17 Difference (actual minus planned) |
|---|---|---|
| 103 | 94 | (9) |
Note: Actual full-time equivalents (FTE) utilization is less than planned as a result of re-alignment of FTEs to the Community Economic Growth program in support of Canada 150 activities and related project development work.
__________
Results: what we achieved
Program 1.2: Community Economic Growth
Description
Community Economic Growth involves economic development initiatives that support communities to advance their economies, adjust to changing and challenging economic circumstances, and recover from depressed economic circumstances. This is achieved through both direct funding of projects, as well as funding support of the Community Futures (CF) organizations. Additionally, this program assists communities to assess community strengths, weaknesses, opportunities, and potential for new economic activity, and to develop and implement community plans. Transfer payments in support of this program are made under the authority of the Western Diversification Program and the Community Futures Program.
Results
WD tracks three indicators to capture the impact of the Community Economic Growth program:
- SME sales growth;
- number of communities benefitting from Community Economic Growth projects; and
- number of communities benefitting from federal public infrastructure investments.
WD met or exceeded its targets for two of the three program performance indicators (see Performance Results table on page 15).
The target for SME sales growth indicator was 12.5 percent and the actual result was 11.2 percent. The target for number of communities benefitting from Community Economic Growth projects was 1,166 and the actual result was 1,609. The variance in communities benefitting from Community Economic Growth projects was due to increased demand from businesses in rural Western Canada for services offered by CFs to start, maintain and grow their businesses.
The target for the number of communities benefitting from federal public infrastructure investments was 235 and the actual result was 76. The reason for this variance is that infrastructure projects have taken longer to complete than planned due to delays attributed to unfavourable weather conditions, regulatory approvals and tendering processes, shifting results into next fiscal year.
In support of the Government of Canada priority of inclusive growth, the WCBSN partners provided training to over 32,000 participants. WCBSN partners also provided 45,545 business advisory services to businesses in rural and urban areas. In addition, the CFs provided 1,482 loans to rural businesses with a value of $81.9 million that leveraged an additional $80.1 million. The WEIs provided 91 loans to women-owned businesses with a value of $6.7 million that leveraged an additional $5.8 million. WCBSN impacts included 5,147 jobs created, maintained, or expanded through lending. The Canada Business Network provided over 155,606 business information, advisory and training services across Western Canada.
WD continued to support official language minority communities in Western Canada under the Government of Canada’s strategy for official languages: Roadmap for Canada’s Official Languages (2013–2018) and spent $0.6 million in support of five ongoing Economic Development Initiative (EDI) projects. Overall, WD leveraged $1.22 of funds from other sources for every dollar it contributed to EDI projects.
In September 2016, the Government of Canada announced the $4.6 million Churchill and Region Economic Development Fund as a response to economic instability facing the Town of Churchill and surrounding region, following a reduction in rail service and closure of the 2016 grain shipping season. The fund is administered by Community Futures Manitoba and will assist the Churchill region to make a successful transition to a diversified and self-sustaining community. The fund is broad in scope and supports projects that promote business development, job creation and local economic growth. To date, the fund has approved $1.9 million in funding for seven projects.
WD continued to support Indigenous economic growth in West Coast energy opportunities and clean energy development by administering seven Strategic Partnerships Initiative (SPI) projects, representing investments of over $7.7 million. The SPI is a whole of government program designed to increase Indigenous Peoples’ participation in economic development opportunities. Three of these projects were completed in 2016–17, resulting in the participation of 64 Indigenous communities, the creation of 32 new partnerships, and 20 jobs created or maintained. Ongoing SPI projects include the BC Indigenous Clean Energy Initiative, which in 2016–17 provided over $1 million in early-stage planning and capacity funds to eight communities pursuing clean energy development.
A 2016–17 analysis of data submitted by CFs regarding their loan clients, compared to similarly sized and located companies contained in Statistics Canada’s database, demonstrated strong performance by CFs[10].
- Employment Growth: CF-assisted firms grew at a compounded rate of 8.0 percent per year compared to 2.9 percent for non-assisted firms from 2009 to 2014.
- Sales Growth: CF-assisted firms grew at a compounded rate of 11.2 percent compared to 6.2 percent for non-assisted firms from 2009 to 2014.
- Firm Longevity: CF-assisted firms exhibited stronger firm longevity than firms in the comparable group, especially in the long run. There was a 66 percent survival rate after five years for CF-assisted businesses versus 46 percent for non-assisted.
- Industry Diversification: CF organizations are lending to a slightly less diversified client base than the comparable group.
In support of the Government of Canada infrastructure priority, 2016–17 saw WD complete 76 CIP 150 projects in over 55 centres across Western Canada, contributing to the health and well-being of communities by enhancing local community infrastructure.
WD held a second call for proposals for the Canada 150 Community Infrastructure Program (CIP 150) and approved 320 projects totalling nearly $46.2 million to support the renovation, expansion, and improvements of existing community infrastructures.
Budget 2016 provided an additional $150 million to Canada’s Regional Development Agencies to deliver this program. WD is responsible for administering the program in Western Canada. The CIP 150 is part of Canada 150 Celebrates, the Government of Canada’s celebration of the 150th anniversary of Confederation.
A key lesson from the CIP 150 is recognizing that small community organizations often require more than one construction season to complete projects and take this into account during performance indicator target setting. Another lesson is to ensure that there is sufficient time to engage with recipients during the defining of project milestones.
Results achieved
| Expected results | Performance indicators | Target | Date to achieve target | 2016–17 Actual results | 2015–16 Actual results | 2014–15 Actual results |
|---|---|---|---|---|---|---|
| Western Canadian communities have strong businesses | SME sales growth | 12.5% | March 31, 2017 | 11.2% | 9.9% | 10.2% |
| Western Canadian communities have capacity for socio-economic development | Number of communities benefitting from Community Economic Growth projects | 1,166 | March 31, 2017 | 1,609 | 1,468 | 1,338 |
| Western Canadian communities have the necessary public infrastructure to support economic growth | Number of communities benefitting from federal public infrastructure investments | 235 | March 31, 2017 | 76 | n/a* | n/a* |
* No results for infrastructure programming were expected for either 2014–15 or 2015-16. The results of WD's work to support community infrastructure through programs delivered on behalf of Infrastructure Canada (e.g., Building Canada Fund) are reported through Infrastructure Canada. The results achieved for 2016–17 represents projects completed under the CIP 150.
Budgetary financial resources (dollars)
| 2016-17 Main Estimates |
2016-17 Planned spending |
2016-17 Total authorities available for use |
Actual spending (authorities used) |
2016-17 Difference (actual minus planned) |
|---|---|---|---|---|
| 57,322,492 | 57,322,492 | 85,253,054 | 74,268,687 | 16,946,195 |
Note: Additional funds received for the delivery of CIP 150 and the Churchill and Regional Economic Development Fund.
Human resources (full-time equivalents)
| 2016–17 Planned | 2016–17 Actual | 2016–17 Difference (actual minus planned) |
|---|---|---|
| 38 | 48 | 10 |
Note: Actual FTE utilization is higher than planned as a result of increased activities to support CIP 150.
Results: what we achieved
Program 1.3: Policy, Advocacy and Coordination
Description
Policy, Advocacy, and Coordination arises from the Western Economic Diversification Act and empowers the Minister to advance the interests of Western Canada through policies and programs and by establishing cooperative relationships with key stakeholders. Policy, Advocacy and Coordination efforts enable WD to: provide a strong voice for Western Canada, which results in effective strategies, policies, and programs that address economic development needs; lead federal and intergovernmental collaboration to pursue key opportunities for long-term growth and diversification in areas of federal or shared federal-provincial jurisdiction; and, enable economic analysis activities to be carried out, which ultimately assist with informing policy and program decisions. Transfer payments in support of this program are made under the authority of the Western Diversification Program.
Results
Through economic analysis and stakeholder engagement, Western Economic Diversification Canada (WD) continually refines its Policy, Advocacy and Coordination (PAC) program to meet the changing priorities of western Canadians and the needs of the business community.
Through its advocacy and coordination role, WD brought together key stakeholders to respond to growing opportunities and challenges in Western Canada. For example, WD held a roundtable discussion of key leaders from incubators and accelerators across Canada on December 15, 2016 regarding how to develop and enhance business assistance services for technology entrepreneurs and companies in Saskatchewan. This roundtable discussion informed the vision for the launch of Co.Labs, Saskatchewan’s first technology incubator.
WD; Innovation, Science and Economic Development Canada; Public Health Agency of Canada; and Indigenous and Northern Affairs Canada organized the Manitoba Indigenous Foresight Initiative, which engaged government and the Indigenous community to develop collaborative strategies and actions to improve social economic conditions for Indigenous peoples of Manitoba. The initiative included a data sharing forum with more than 100 participants learning about data and trends related to Indigenous peoples. There was also a foresight incubator event with over 120 participants learning about innovative ways of collaborating and working towards a future where reconciliation and self-determination have been realized. As a result of this initiative, WD has committed to exploring ways to further incorporate Indigenous perspectives into its work.
In November 2016, WD, in partnership with the Canadian Association of Defence and Security Industries, Mitacs, and the Canadian Commercial Corporation, held the third Western Innovation Forum in Vancouver, BC. This event, with an emphasis on innovation-driven investment, partnership, and business opportunities in the aerospace and defence sectors, attracted more than 450 participants from 210 organizations. WD created opportunities for western Canadian industry by arranging 364 pre-screened business-to-business meetings between companies, academia, research organizations, and global aerospace and defence companies.
Caring for communities in need WD played a lead role during the Fort McMurray wildfire in May 2016 with regards to federal recovery and rebuilding efforts, and coordinating with various stakeholders.
The Fort McMurray wildfire in May 2016 was an unprecedented natural disaster in Canadian history, driving 90,000 people from their homes and impacting Alberta’s largest industry—the oil and gas sector. WD played a lead federal role with regard to recovery and rebuilding. This involved working with numerous federal departments, the Government of Alberta, Regional Municipality of Wood Buffalo, and Canadian Red Cross to coordinate the federal response and ensure effective collaboration with provincial and local governments. WD also worked through its service delivery partner, Community Futures Wood Buffalo, to provide local business recovery assistance and utilized one of its funding programs—CIP 150—to assist communities affected by the wildfire.
Through its on-the-ground intelligence gathering and economic analysis, WD identifies key issues and supports policy development at the departmental and national level to identify challenges. For example, WD undertook research on the venture capital (VC) market in Western Canada that identified developments over the last three years and long-term trends in VC investments. This research enhances the Government of Canada’s understanding of innovation investment in Western Canada and supports WD’s decision making and advocacy to develop the economy.
Results achieved
| Expected results | Performance indicators | Target | Date to achieve target | 2016–17 Actual results | 2015–16 Actual results | 2014–15 Actual results |
|---|---|---|---|---|---|---|
| Policies that strengthen the western Canadian economy | Percentage of key informants with the opinion that WD activities resulted in policies that support the economic development of Western Canada | 90% | March 31, 2017 | n/a | n/a | 82.7% |
| Programs that strengthen the western Canadian economy | Percentage of key informants with the opinion that WD activities resulted in programs that support the economic development of Western Canada | 90% | March 31, 2017 | n/a | n/a | 87.0% |
Note: Results are based on a 2014 WD survey of PAC stakeholders.[11] This survey was not conducted this year because WD is in the process of revising its reporting framework to allow better reporting in the future.
Budgetary financial resources (dollars)
| 2016-17 Main Estimates |
2016-17 Planned spending |
2016-17 Total authorities available for use |
2016-17 Actual spending (authorities used) |
2016-17 Difference (actual minus planned) |
|---|---|---|---|---|
| 8,414,266 | 8,414,266 | 8,736,387 | 6,840,485 | (1,573,781) |
Note: Actual spending is lower than planned as a result of a project delay which required the money to be re-profiled to a future year.
Human resources (full-time equivalents)
| 2016–17 Planned | 2016–17 Actual | 2016–17 Difference (actual minus planned) |
|---|---|---|
| 55 | 58 | 3 |
Information on WD's lower-level programs is available on the TBS InfoBase.
Internal Services
Description
Internal Services are those groups of related activities and resources that the federal government considers to be services in support of programs and/or required to meet corporate obligations of an organization. Internal Services refers to the activities and resources of the 10 distinct service categories that support Program delivery in the organization, regardless of the Internal Services delivery model in a department. The 10 service categories are: Management and Oversight Services; Communications Services; Legal Services; Human Resources Management Services; Financial Management Services; Information Management Services; Information Technology Services; Real Property Services; Materiel Services; and Acquisition Services.
Results
In 2016–17, WD continues to undertake a number of initiatives to create a technology and systems-enabled workplace to support the Government of Canada's Blueprint 2020 goals of enhancing service delivery, boosting value for money, and maintaining an efficient and high-performing organization. For example, WD continues its engagement with the other regional development agencies in the design and build of a common client-centric information management/information technology system to support online delivery of grants and contributions programs. In addition, the Western Canada Business Service Network - external link (WCBSN) transitioned to a new interactive web portal and online reporting system to automate the previously manual processes of performance reporting.
WD also contributes to the Government of Canada’s Open Government initiative by making relevant data accessible to the Canadian public and the businesses community through the Government of Canada's Open Data Inventory portal. This portal provides one-stop access to the Government of Canada’s searchable open data and open information, together with open dialogue, as part of the federal government’s commitment to enhance transparency and accountability.
Concerted efforts have been made by internal Occupational Health and Safety Committees to ensure the physical and mental well-being of staff through initiatives like ergonomic training and participation in the Canadian Mental Health Association’s Not Myself Today campaign.
WD completed the modernization of its Edmonton and Ottawa offices in November 2016 and commenced the modernization of its Winnipeg offices towards Government of Canada Workplace 2.0 standards that will encourage employees to work smarter, greener, and healthier in order to serve Canadians. For example, each staff member was provided with height adjustable work surfaces and office ergonomic training to create a more active workplace. The new work environment is expected to promote collaboration between employees throughout the offices and to foster a knowledge sharing environment between WD units.
Furthermore, WD continues to invest in and expand the use of video conferencing, web-based tools and other wireless connectivity technologies for participating in and conducting inter-regional meetings, training sessions, and day-to-day activities. This aligns WD with the government’s workplace modernization and Destination 2020 strategy.
WD is a participant in the Federal Sustainable Development Strategy (FSDS) and contributes to the Greening Government Operations targets through the Internal Services program. The department contributes to the following target areas of Theme IV (Shrinking the Environmental Footprint – Beginning with Government) of the FSDS: e-waste, printing unit reduction, paper consumption, green meetings, and green procurement. For additional details on WD's Departmental Sustainable Development Strategy, please see the list of Supplementary Information Tables in Section III.
Budgetary financial resources (dollars)
| 2016-17 Main Estimates | 2016-17 Planned spending | 2016-17 Total authorities available for use | 2016-17 Actual spending (authorities used) | 2016-17 Difference (actual minus planned) |
|---|---|---|---|---|
| 12,519,328 | 12,519,328 | 12,996,209 | 12,553,089 | 33,761 |
Human resources (full-time equivalents)
| 2016–17 Planned |
2016–17 Actual |
2016–17 Difference (actual minus planned) |
|---|---|---|
| 91 | 92 | 1 |
Analysis of trends in spending and human resources
Actual expenditures
Departmental Spending Trend Graph
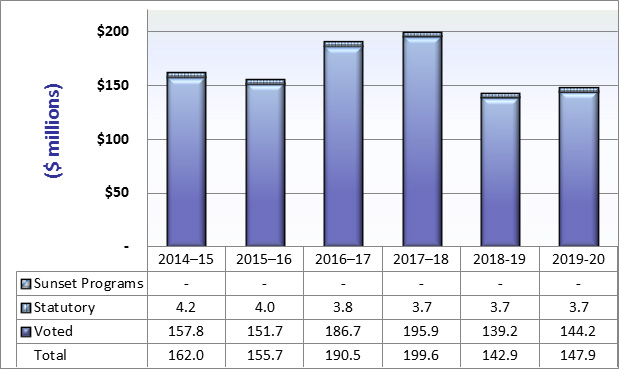
The figures presented in the chart above reflect the impact the Canada 150 Community Infrastructure Program had on the department's overall spending. Actual and planned spending increased in 2016–17 and 2017–18 as a result of the introduction of the program.
In addition, the figures presented in the chart above do not include funds spent on behalf of other government departments. For example, in fiscal year 2016–17, WD expended approximately $9.1 million on behalf of Infrastructure Canada, under the Building Canada Fund.
Budgetary performance summary for Programs and Internal Services (dollars)
| Programs and Internal Services | 2016-17 Main Estimates | 2016-17 Planned Spending | 2017-18 Planned Spending | 2018-19 Planned Spending | 2016-17 Total Authorities Available for Use | 2016-17 Actual Spending (authorities used) | 2015-16 Actual Spending (authorities used) | 2014-15 Actual Spending (authorities used) |
|---|---|---|---|---|---|---|---|---|
| Program 1.1: Business Development and Innovation | 95,135,450 | 95,135,450 | 98,714,063 | 89,463,252 | 97,106,096 | 96,821,013 | 97,298,416 | 107,678,368 |
| Program 1.2: Community Economic Growth | 57,322,492 | 57,322,492 | 80,086,272 | 33,169,912 | 85,253,054 | 74,268,687 | 35,240,300 | 31,958,193 |
| Program 1.3: Policy, Advocacy and Coordination | 8,414,266 | 8,414,266 | 8,665,668 | 8,811,323 | 8,736,387 | 6,840,485 | 8,922,602 | 8,736,194 |
| Subtotal | 160,872,208 | 160,872,208 | 187,466,003 | 131,444,487 | 191,095,537 | 177,930,185 | 141,461,318 | 148,372,755 |
| Internal Services | 12,519,328 | 12,519,328 | 12,153,056 | 11,424,572 | 12,996,209 | 12,553,089 | 14,230,056 | 13,629,781 |
| Total | 173,391,536 | 173,391,536 | 199,619,059 | 142,869,059 | 204,091,746 | 190,483,274 | 155,691,374 | 162,002,536 |
Planned spending of $173.4 million for 2016–17 increased by $30.7 million and was provided by new authorities and transfers, including $23.1 million for funds received to deliver the Canada 150 Community Infrastructure Program, $4.6 million received for the Churchill and Region Economic Development Fund, $1.3 million from collections of repayable contributions, $1.8 million for an operating budget carry forward, and a reduction of $0.1 million for various other minor adjustments.
Actual spending of $190.5 million exceeds planned spending by $17.1 million. This variance is primarily related to $12.3M for the delivery of the Canada 150 Community Infrastructure Program and amounts provided by new authorities and transfers.
Actual human resources
Human resources summary for Programs and Internal Services
(full-time equivalents)
| Programs and Internal Services | 2014–15 Actual |
2015–16 Actual |
2016–17 Forecast |
2016–17 Actual |
2017–18 Planned |
2018–19 Planned |
|---|---|---|---|---|---|---|
| Program 1.1: Business Development and Innovation |
107 | 99 | 103 | 94 | 103 | 113 |
| Program 1.2: Community Economic Growth |
35 | 38 | 38 | 48 | 36 | 25 |
| Program 1.3: Policy, Advocacy and Coordination |
58 | 56 | 55 | 58 | 59 | 60 |
| Subtotal | 200 | 193 | 196 | 200 | 198 | 198 |
| Internal Services | 95 | 94 | 91 | 92 | 85 | 85 |
| Total | 295 | 287 | 287 | 292 | 283 | 283 |
Human resource levels in WD continue to be stable and the minor fluctuations that occur reflect resource realignments in support of priorities and projects. The department will continue to achieve its results by allocating its human resources to best support its programs.
Expenditures by vote
For information on the WD's organizational voted and statutory expenditures, consult the Public Accounts of Canada 2017.
Alignment of spending with the whole-of-government framework
| Program | Spending area | Government of Canada activity | 2016-17 Actual spending |
|---|---|---|---|
| 1.1 Business Development and Innovation | Economic Affairs | Strong economic growth | 96,821,013 |
| 1.2 Community Economic Growth | Economic Affairs | Strong economic growth | 74,268,687 |
| 1.3 Policy, Advocacy and Coordination | Economic Affairs | Strong economic growth | 6,840,485 |
| Spending area | Total planned spending | Total actual spending |
|---|---|---|
| Economic affairs | 160,872,208 | 177,930,185 |
| Social affairs | 0 | 0 |
| International affairs | 0 | 0 |
| Government affairs | 0 | 0 |
Financial statements and financial statements highlights
Financial statements
The complete WD financial statements [unaudited] for the year ended March 31, 2017 are available on the departmental website.
Financial statements highlights
The financial highlights presented within this Departmental Results Report are intended to serve as a general overview of WD's financial position and operations. The unaudited financial statements are prepared in accordance with accrual accounting principles (the link to complete financial statements is above).
Condensed Statement of Operations (unaudited) for the year ended
March 31, 2017 (dollars)
| Financial Information | 2016-17 Planned Results |
2016-17 Actual |
2015-16 Actual |
Difference (2016-17 actual minus 2016-17 planned) | Difference (2016-17 actual minus 2015-16 actual) |
|---|---|---|---|---|---|
| Total expenses | 163,137,857 | 165,735,769 | 136,890,171 | 2,597,912 | 28,845,598 |
| Total revenues | 1,244 | 2,240 | 3,244 | 996 | (1,004) |
| Net cost of operations before government funding and transfers | 163,136,613 | 165,733,529 | 136,886,927 | 2,596,916 | 28,846,602 |
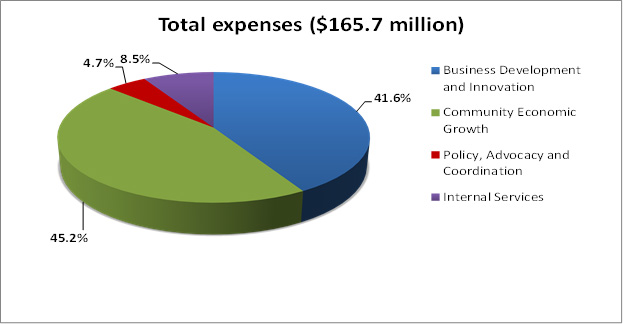
Total expenses were $165.7 million in 2016-17, a net increase of $28.8 million (21 percent) over 2015-16. This year-over-year net increase is attributed to an increase of $35.4 million for projects funded under the Canada 150 Community Infrastructure Program, a decrease of $3.3 million in other transfer payment spending and a decrease of $3.3 million in personnel and other operating costs.
Condensed Statement of Financial Position (unaudited) as at March 31, 2017 (dollars)
| Financial Information | 2016-17 | 2015-16 | Difference (2016-17 minus 2015-16) |
|---|---|---|---|
| Total net liabilities | 63,847,740 | 56,291,696 | 7,556,044 |
| Total net financial assets | 61,389,994 | 53,412,053 | 7,977,941 |
| Departmental net debt | (2,457,746) | (2,879,643) | 421,897 |
| Total non-financial assets | 76,786 | 90,885 | (14,099) |
| Departmental net financial position | (2,380,960) | (2,788,758) | 407,798 |
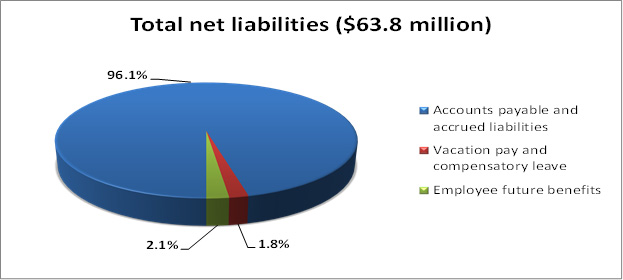
Total net liabilities were $63.8 million at the end of 2016-17, a net increase of $7.5 million (13 percent) over 2015-16. This year-over-year net increase is attributed two-fold: (i) the establishment of accounts payable balances for the Canada 150 Community Infrastructure Program and the Western Innovation Initiative, and (ii) reductions in accounts payable balances not required due to the completion of projects funded under the Western Diversification Program, and projects no longer administered on behalf of Infrastructure Canada.
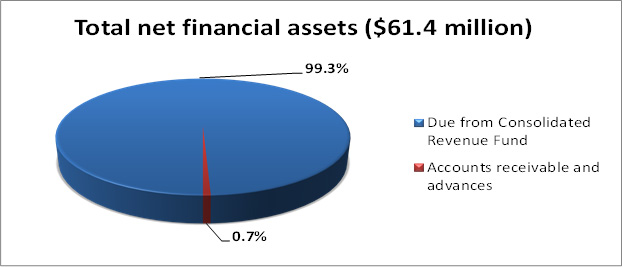
Total net financial assets were $61.4 million at the end of 2016-17, an increase of $8 million (15 percent) over 2015-16. This year-over-year increase in these assets primarily consists of the "Due from Consolidated Revenue Fund" ($61 million), which is used to discharge WD's liabilities. Given WD's liabilities were higher than the previous fiscal year, the "Due from Consolidated Revenue Fund" also increased.
Supplementary Information
Corporate information
Organizational profile
Appropriate Minister:
The Honourable Navdeep Bains, P.C., M.P.
Minister of Innovation, Science and Economic Development
Institutional head: Dylan Jones
Ministerial portfolio: Innovation, Science and Economic Development
Enabling instrument(s):
Western Economic Diversification Act, R.S.C. 1985, c.11, (4th Supplement)
Year of incorporation / commencement: 1987
Other:
Headquarters - Edmonton, Alberta
Offices - Vancouver, British Columbia
Edmonton and Calgary, Alberta
Saskatoon, Saskatchewan
Winnipeg, Manitoba
Ottawa, Ontario
Reporting framework
The Western Economic Diversification Canada’s (WD) Strategic Outcome and Program Alignment Architecture of record for 2016-17 are shown below:
-
Strategic Outcome: A growing and diversified western Canadian economy
-
1.1 Program: Business Development and Innovation
- 1.1.1 Sub-Program: Trade, Investment and Market Access
- 1.1.2 Sub-Program: Business Productivity and Growth
- 1.1.3 Sub-Program: Innovation Capacity Building
- 1.1.4 Sub-Program: Technology Commercialization
-
1.2 Program: Community Economic Growth
- 1.2.1 Sub-Program: Infrastructure Programming
- 1.2.2 Sub-Program: Community Development
- 1.2.3 Sub-Program: Community Futures Program
- 1.2.4 Sub-Program: Targeted Economic Initiatives
-
1.3 Program: Policy, Advocacy and Coordination
- 1.3.1 Sub-Program: Advocacy and Coordination
- 1.3.2 Sub-Program: Economic Analysis
- Internal Services
-
1.1 Program: Business Development and Innovation
Supporting information on lower-level programs
Supporting information on results, financial and human resources related to WD's Program Inventory is available in the TBS InfoBase.
Supplementary information tables
The following supplementary information tables are available on the WD website.
- Departmental Sustainable Development Strategy - internal link
- Details on Transfer Payments of $5 Million or More - internal link
- Internal Audits and Evaluations - internal link
- Response to Parliamentary Committees - internal link
- Up-Front Multi-year Funding - internal link
- User Fees Reporting - internal link
- Performance Measurement Framework Methodologies - internal link
Federal tax expenditures
The tax system can be used to achieve public policy objectives through the application of special measures such as low tax rates, exemptions, deductions, deferrals and credits. The Department of Finance Canada publishes cost estimates and projections for these measures each year in the Report on Federal Tax Expenditures. This report also provides detailed background information on tax expenditures, including descriptions, objectives, historical information and references to related federal spending programs. The tax measures presented in this report are the responsibility of the Minister of Finance.
Organizational contact information
Western Economic Diversification Canada
Suite 1500, 9700 Jasper Avenue
Edmonton, Alberta T5J 4H7
Telephone: 780-495-4164
Fax: 780-495-4557
Web: www.wd-deo.gc.ca
Appendix: definitions
appropriation (credit)
Any authority of Parliament to pay money out of the Consolidated Revenue Fund.
budgetary expenditures (dépenses budgétaires)
Operating and capital expenditures; transfer payments to other levels of government, organizations or individuals; and payments to Crown corporations.
Core Responsibility (responsabilité essentielle)
An enduring function or role performed by a department. The intentions of the department with respect to a Core Responsibility are reflected in one or more related Departmental Results that the department seeks to contribute to or influence.
Departmental Plan (Plan ministériel)
Provides information on the plans and expected performance of appropriated departments over a three-year period. Departmental Plans are tabled in Parliament each spring.
Departmental Result (résultat ministériel)
A Departmental Result represents the change or changes that the department seeks to influence. A Departmental Result is often outside departments’ immediate control, but it should be influenced by program-level outcomes.
Departmental Result Indicator (indicateur de résultat ministériel)
A factor or variable that provides a valid and reliable means to measure or describe progress on a Departmental Result.
Departmental Results Framework (cadre ministériel des résultats)
Consists of the department’s Core Responsibilities, Departmental Results and Departmental Result Indicators.
Departmental Results Report (Rapport sur les résultats ministériels)
Provides information on the actual accomplishments against the plans, priorities and expected results set out in the corresponding Departmental Plan.
Evaluation (évaluation)
In the Government of Canada, the systematic and neutral collection and analysis of evidence to judge merit, worth or value. Evaluation informs decision making, improvements, innovation and accountability. Evaluations typically focus on programs, policies and priorities and examine questions related to relevance, effectiveness and efficiency. Depending on user needs, however, evaluations can also examine other units, themes and issues, including alternatives to existing interventions. Evaluations generally employ social science research methods.
full-time equivalent (équivalent temps plein)
A measure of the extent to which an employee represents a full person-year charge against a departmental budget. Full-time equivalents are calculated as a ratio of assigned hours of work to scheduled hours of work. Scheduled hours of work are set out in collective agreements.
government-wide priorities (priorités pangouvernementales)
For the purpose of the 2017–18 Departmental Plan, government-wide priorities refers to those high-level themes outlining the government’s agenda in the 2015 Speech from the Throne, namely: Growth for the Middle Class; Open and Transparent Government; A Clean Environment and a Strong Economy; Diversity is Canada's Strength; and Security and Opportunity.
horizontal initiatives (initiatives horizontales)
An initiative where two or more federal organizations, through an approved funding agreement, work toward achieving clearly defined shared outcomes, and which has been designated (for example, by Cabinet or a central agency) as a horizontal initiative for managing and reporting purposes.
Management, Resources and Results Structure (Structure de la gestion, des ressources et des résultats)
A comprehensive framework that consists of an organization’s inventory of programs, resources, results, performance indicators and governance information. Programs and results are depicted in their hierarchical relationship to each other and to the Strategic Outcome(s) to which they contribute. The Management, Resources and Results Structure is developed from the Program Alignment Architecture.
non-budgetary expenditures (dépenses non budgétaires)
Net outlays and receipts related to loans, investments and advances, which change the composition of the financial assets of the Government of Canada.
performance (rendement)
What an organization did with its resources to achieve its results, how well those results compare to what the organization intended to achieve, and how well lessons learned have been identified.
performance indicator (indicateur de rendement)
A qualitative or quantitative means of measuring an output or outcome, with the intention of gauging the performance of an organization, program, policy or initiative respecting expected results.
performance reporting (production de rapports sur le rendement)
The process of communicating evidence-based performance information. Performance reporting supports decision making, accountability and transparency.
planned spending (dépenses prévues)
For Departmental Plans and Departmental Results Reports, planned spending refers to those amounts that receive Treasury Board approval by February 1. Therefore, planned spending may include amounts incremental to planned expenditures presented in the Main Estimates. A department is expected to be aware of the authorities that it has sought and received. The determination of planned spending is a departmental responsibility, and departments must be able to defend the expenditure and accrual numbers presented in their Departmental Plans and Departmental Results Reports.
plans (plans)
The articulation of strategic choices, which provides information on how an organization intends to achieve its priorities and associated results. Generally a plan will explain the logic behind the strategies chosen and tend to focus on actions that lead up to the expected result.
priorities (priorités)
Plans or projects that an organization has chosen to focus and report on during the planning period. Priorities represent the things that are most important or what must be done first to support the achievement of the desired Strategic Outcome(s).
program (programme)
A group of related resource inputs and activities that are managed to meet specific needs and to achieve intended results and that are treated as a budgetary unit.
Program Alignment Architecture (architecture d’alignement des programmes)
A structured inventory of an organization’s programs depicting the hierarchical relationship between programs and the Strategic Outcome(s) to which they contribute.
results (résultats)
An external consequence attributed, in part, to an organization, policy, program or initiative. Results are not within the control of a single organization, policy, program or initiative; instead they are within the area of the organization’s influence.
statutory expenditures (dépenses législatives)
Expenditures that Parliament has approved through legislation other than appropriation acts. The legislation sets out the purpose of the expenditures and the terms and conditions under which they may be made.
Strategic Outcome (résultat stratégique)
A long-term and enduring benefit to Canadians that is linked to the organization’s mandate, vision and core functions.
sunset program (programme temporisé)
A time-limited program that does not have an ongoing funding and policy authority. When the program is set to expire, a decision must be made whether to continue the program. In the case of a renewal, the decision specifies the scope, funding level and duration.
target (cible)
A measurable performance or success level that an organization, program or initiative plans to achieve within a specified time period. Targets can be either quantitative or qualitative.
voted expenditures (dépenses votées)
Expenditures that Parliament approves annually through an Appropriation Act. The Vote wording becomes the governing conditions under which these expenditures may be made.
Supplementary Information Tables
- Departmental Sustainable Development Strategy - internal link
- Details on Transfer Payments of $5 Million or More - internal link
- Internal Audits and Evaluations - internal link
- Response to Parliamentary Committees - internal link
- Up-Front Multi-year Funding - internal link
- User Fees Reporting - internal link
- Performance Measurement Framework Methodologies - internal link
Departmental Sustainable Development Strategy
1. Overview of the federal government’s approach to sustainable development
The 2013–16 Federal Sustainable Development Strategy (FSDS) presents the Government of Canada’s sustainable development activities, as required by the Federal Sustainable Development Act. In keeping with the objectives of the Act to make environmental decision making more transparent and accountable to Parliament, Western Economic Diversification (WD) supports the implementation of the FSDS through the activities described in this supplementary information table.
2. Our Departmental Sustainable Development Strategy
This Departmental Sustainable Development Strategy describes WD’s actions in support of Theme I: addressing climate change and air quality; Theme II: maintaining water quality and availability; and Theme IV: shrinking the environmental footprint, beginning with government. The report for 2016–17 presents a high-level overview of results and is the final report under the 2013–16 FSDS. Last year’s report is available on the departmental website - internal link.
3. Departmental performance highlights
Themes I and II: WD investments in clean energy and clean water
Through the FSDS, WD has committed to diversify the western Canadian economy by making strategic investments in the commercialization and adoption of clean energy and clean water technologies through the Western Diversification Program and the Western Innovation Initiative. Under Theme I, WD contributed to the 2013–16 FSDS through one implementation strategy for Goal 1: Climate Change (1.1.39) and Goal 2: Air Pollution (2.1.4). Under Theme II, WD contributed to the 2013–16 FSDS through one implementation strategy for Goal 3: Water Quality (3.12.2).
WD has three key program areas that frame program investments: business development and innovation; community economic growth; and policy, advocacy and coordination. The technology commercialization sub-program and innovation capacity building sub-program are components of WD's business development and innovation program area. WD's FSDS implementation strategies related to clean energy and clean water technologies are met through the Department's Business Development and Innovation Program. Specifically, WD's investments in clean energy and clean water technologies are made through the technology commercialization and innovation capacity building sub-programs, through which WD supports projects designed to increase the number of western Canadian technologies brought to market.
Implementation strategies: performance summary
WD's strategic investments in clean energy and water technologies are measured using the performance indicators associated with the sub-programs of technology commercialization and innovation capacity building. In 2015–16, WD committed $19.8 million to 20 projects which are anticipated to result in technology adoption and demonstration for innovative clean energy technologies. These commitments leveraged an additional $38.2 million from not-for-profits and industry partners.
Theme IV: shrinking the environmental footprint, beginning with government
Under Theme IV, WD contributed to the 2013–16 FSDS through eleven implementation strategies for Goal 7: Waste and Asset Management.
| FSDS goal | FSDS target | FSDS performance indicator | FSDS performance results |
|---|---|---|---|
|
Goal 7: waste and asset management Reduce waste generated, and minimize the environmental impacts of assets throughout their life cycle. |
Target 7.2: green procurement As of April 1, 2014, the Government of Canada will continue to take action to embed environmental considerations into public procurement, in accordance with the federal Policy on Green Procurement. Target 7.3: sustainable workplace operations. As of April 1, 2015 the Government of Canada will update and adopt policies and practices to improve the sustainability of its workplace operations. |
Departmental approach to further the implementation of the Policy on Green Procurement in place [Yes / No]
|
Yes |
|
Number and percentage of specialists in procurement and/or material management who have completed the Canada School of Public Service Procurement course or equivalent, in the given fiscal year.
|
Four (100%) |
||
|
Number and percentage of managers and functional heads of procurement and materiel whose performance evaluation includes support and contribution toward green procurement, in the given fiscal year
|
Two (100%) |
||
|
Dollar value or volume of IT hardware purchases that meet the target objective relative to the total dollar value or volume of all purchase for IT hardware in the given year.
|
100% |
||
|
Volume of toner cartridges recycled relative to the total volume of all toner cartridges purchased in the year in question.
|
100% |
||
|
Percentage of accommodation stays that meet the target objective relative to the total dollar value or number of all accommodation stays in the given year.
|
70.5% |
||
|
Approach to maintain or improve the sustainability of the departmental workplace [Yes / No] |
Yes |
Implementation strategies: performance summary
WD has achieved all of its implementation strategies in place to succeed for Goal 7: waste and asset management.
| Implementation strategy element or best practice | Performance level achieved |
|---|---|
| 7.2.1.5. Leverage common-use procurement instruments where available and feasible. | Achieved |
| Best Practice 7.2.3. Train acquisition cardholders on green procurement. |
Achieved |
| 7.3.1.1. Engage employees in greening government operations practices. | Achieved |
| 7.3.1.2. Integrate environmental considerations into corporate policies, processes and practices in accordance with departmental refresh cycles. | Achieved |
| 7.3.1.3. Maintain or improve existing approaches to sustainable workplace practices (printer ratios, paper usage, and green meetings). | Achieved |
| 7.3.1.4. Minimize the ratio of IT assets per employee. | Achieved |
| 7.3.1.5. Select and operate IT and office equipment in a manner that reduces energy consumption and material usage. | Achieved |
| 7.3.1.6. Dispose of e-waste in an environmentally sound and secure manner. | Achieved |
| 7.3.1.7. Reuse or recycle workplace materiel and assets in an environmentally sound and secure manner. | Achieved |
| 7.3.1.8. Minimize all non-hazardous solid waste generated, and leverage service offerings to maximize the diversion of waste. | Achieved |
| 7.3.1.9. Increase the population density in office buildings, and increase space utilization in special purpose buildings. | Achieved |
4. Report on Strategic Environmental Assessment
During the 2016–17 reporting cycle, WD considered the environmental effects of initiatives subject to the Cabinet Directive on the Environmental Assessment of Policy, Plan and Program Proposals, as part of its decision-making processes. As WD did not develop any initiatives that required a Strategic Environmental Assessment, no related public statements were produced.
Details on Transfer Payments of $5 Million or More
- Western Diversification Program - internal link (WDP)
- Community Futures Program (CF)
- Canada 150 Community Infrastructure Program (Voted)
General Information
| Name of transfer payment program | Western Diversification Program (WDP) |
|---|---|
| Start date | December 3, 1987 |
| End date | Ongoing |
| Type of transfer payment | Contribution |
| Type of appropriation | Annually through Estimates |
| Fiscal year for terms and conditions | 2010-11 |
| Strategic Outcome | A growing and diversified western Canadian economy. |
| Link to depatment's Program Alignment Architecture |
Program 1.1: Business Development and Innovation Program 1.2: Community Economic Growth Program 1.3: Policy, Advocacy and Coordination |
| Description | The WDP contributes to the achievement of the Department's mandate to promote economic development and diversification in Western Canada and advance the West's interests in national policy, program and project development and implementation. Contributions to not-for-profit organizations are non-repayable and contributions to western Canadian small and medium-sized enterprises (SME) under the Western Innovation Initiative are repayable. |
| Results achieved |
Western Economic Diversification Canada (WD) has developed a Performance Measurement Strategy that includes performance indicators, expected results, data sources to capture results achieved under the Department's Program Alignment Architecture (PAA). Key results include:
For complete set of results achieved, refer to the relevant programs and sub-programs tables with performance indicators in the main document and supplementary information on lower-level programs. |
| Comments on variances | Actual spending is higher than planned spending by $5.7 million as a result of additional funding received for Churchill and Region Economic Fund as a response to the economic instability and collections of repayable contributions. |
| Audits completed or planned | WD's internal audit function has been transferred to the Office of the Comptroller General (OCG). All audits of the Regional Development Agencies (RDAs), including WD, will be conducted by OCG in accordance with their RDA Risk-Based Audit Plan (RBAP). The previous WDP audit was completed in September 2009. |
| Evaluations completed or planned | An evaluation of Innovation Programming which is within the Business Development and Innovation Program area, was commenced in 2016–17. An evaluation of defence procurement activities is planned to start during 2017–18. |
| Engagement of applicants and recipients | The WDP and Western Innovation Initiative streams were both delivered through a call for proposals process. Potential applicants and stakeholders are engaged through active outreach, media strategies and information provided on Western Economic Diversification Canada's (WD) public website. |
Program: Policy, Advocacy & Coordination (WDP)
| Type of Transfer Payment | 2014–15 Actual spending |
2015–16 Actual spending |
2016–17 Planned spending |
2016–17 Total authorities available for use |
2016–17 Actual spending (authorities used) |
Variance (2016–17 actual minus 2016–17 planned) |
|---|---|---|---|---|---|---|
| Total grants | 0 | 0 | 0 | 0 | 0 | 0 |
| Total contributions | 1,524,413 | 2,040,418 | $1,500,000 | $1,500,000 | 0 | $($1,500,000) |
| Total other types of transfer payments | 0 | 0 | 0 | 0 | 0 | 0 |
| Total Policy, Advocacy & Coordination | 1,524,413 | 2,040,418 | 1,500,000 | 1,500,000 | 0 | (1,500,000) |
Program: Community Economic Growth (WDP)
| Type of Transfer Payment | 2014–15 Actual spending |
2015–16 Actual spending |
2016–17 Planned spending |
2016–17 Total authorities available for use |
2016–17 Actual spending (authorities used) |
Variance (2016–17 actual minus 2016–17 planned) |
|---|---|---|---|---|---|---|
| Total grants | 0 | 0 | 0 | 0 | 0 | 0 |
| Total contributions | 1,469,847 | 1,490,472 | 1,586,026 | 6,186,026 | 6,064,249 | 4,478,223 |
| Total other types of transfer payments | 0 | 0 | 0 | 0 | 0 | 0 |
| Total Community Economic Growth | 1,469,847 | 1,490,472 | 1,586,026 | 6,186,026 | 6,064,249 | 4,478,223 |
Program: Business Development and Innovation (WDP)
| Type of Transfer Payment | 2014–15 Actual spending |
2015–16 Actual spending |
2016–17 Planned spending |
2016–17 Total authorities available for use |
2016–17 Actual spending (authorities used) |
Variance (2016–17 actual minus 2016–17 planned) |
|---|---|---|---|---|---|---|
| Total grants | 0 | 0 | 5,000,000 | 0 | 0 | (5,000,000) |
| Total contributions | 88,299,914 | 79,208,544 | 71,160,566 | 77,340,198 | 78,919,545 | 7,758,979 |
| Total other types of transfer payments | $0 | $0 | $0 | $0 | $0 | $0 |
| Total Business Development and Innovation | 88,299,914 | 79,208,544 | 76,160,566 | 77,340,198 | 78,919,545 | 2,758,979 |
| Type of Transfer Payment | 2014–15 Actual spending |
2015–16 Actual spending |
2016–17 Planned spending |
2016–17 Total authorities available for use |
2016–17 Actual spending (authorities used) |
Variance (2016–17 actual minus 2016–17 planned) |
|---|---|---|---|---|---|---|
| Total grants | 0 | 0 | 5,000,000 | 0 | 0 | (5,000,000) |
| Total contributions | 91,294,174 | 82,739,434 | 74,246,592 | 85,026,224 | 84,983,794 | 10,737,202 |
| Total other types of transfer payments | 0 | 0 | 0 | 0 | 0 | 0 |
| Total Western Economic Diversification program | 91,294,174 | 82,739,434 | 79,246,592 | 85,026,224 | 84,983,794 | 5,737,202 |
| Name of transfer payment program | Community Futures Program (CF) |
|---|---|
| Start date | May 18, 1995 |
| End date | Ongoing |
| Type of transfer payment | Contribution |
| Type of appropriation | Annually through Estimates |
| Fiscal year for terms and conditions | 2010-11 |
| Strategic Outcome | A growing and diversified western Canadian economy. |
| Link to organization's program(s) | Program 1.2: Community Economic Growth Sub-Program 1.2.3: Community Futures Program |
| Description | This program was designed to provide funding for a network of Community Futures Development Corporations (CFDC) across Canada with WD as the delivery department for the West. CFDCs are volunteer-led, non-profit organizations that lead strategic economic planning, and provide advice and commercial loans to local entrepreneurs, which foster economic development. |
| Results achieved |
Western Economic Diversification Canada (WD) has developed a Performance Measurement Strategy that includes performance indicators, expected results, data sources to capture results achieved under the Department's Program Alignment Architecture. Key results include:
|
| Comments on variances | Not applicable |
| Audits completed or planned | WD's internal audit function has been transferred to the OCG. All audits of the RDAs, including WD, will be conducted by OCG in accordance with their RDA RBAP. |
| Evaluations completed or planned | An evaluation of the CF Program was conducted during 2013–14 and the final report was posted online in September 2014. The next evaluation of the CF Program is planned to be conducted during 2018–19. |
| Engagement of applicants and recipients | Eligible applicants for the CF Program are the CF Organizations. WD has a long standing strategy of engaging with these organizations to build awareness of WD's programs among prospective proponents. |
Program: Community Economic Growth (CF)
| Type of Transfer Payment | 2014–15 Actual spending |
2015–16 Actual spending |
2016–17 Planned spending |
2016–17 Total authorities available for use |
2016–17 Actual spending (authorities used) |
Variance (2016–17 actual minus 2016–17 planned) |
|---|---|---|---|---|---|---|
| Total grants | 0 | 0 | 0 | 0 | 0 | 0 |
| Total contributions | 26,502,066 | 29,790,691 | 28,186,322 | 28,228,125 | 28,228,125 | 41,803 |
| Total other types of transfer payments | 0 | 0 | 0 | 0 | 0 | 0 |
| Total Community Economic Growth | 26,502,066 | 29,790,691 | 28,186,322 | 28,228,125 | 28,228,125 | 41,803 |
| Type of Transfer Payment | 2014–15 Actual spending |
2015–16 Actual spending |
2016–17 Planned spending |
2016–17 Total authorities available for use |
2016–17 Actual spending (authorities used) |
Variance (2016–17 actual minus 2016–17 planned) |
|---|---|---|---|---|---|---|
| Total grants | 0 | 0 | 0 | 0 | 0 | 0 |
| Total contributions | 26,502,066 | 29,790,691 | 28,186,322 | 28,228,125 | 28,228,125 | 41,803 |
| Total other types of transfer payments | $0 | $0 | $0 | $0 | $0 | $0 |
| Total Community Futures program | 26,502,066 | 29,790,691 | 28,186,322 | 28,228,125 | 28,228,125 | 41,803 |
| Name of transfer payment program | Canada 150 Community Infrastructure Program (Voted) |
|---|---|
| Start date | April 1, 2016 |
| End date | March 31, 2018 |
| Type of transfer payment | Contribution |
| Type of appropriation | Annually through Estimates |
| Fiscal year for terms and conditions | 2016-17 |
| Strategic Outcome | A growing and diversified western Canadian economy. |
| Link to organization's program(s) | Program 1.2: Community Economic Growth Sub-Program 1.2.1: Infrastructure Programming |
| Description |
The Canada 150 Infrastructure Program is part of the Canada 150 Initiative, the Government of Canada's celebration of Canada's 150th anniversary. Through investments in community infrastructure, the Government of Canada is investing $300 million over two years in projects that celebrate our shared heritage, create jobs, and improve the quality of life for Canadians. Western Economic Diversification Canada (WD), on behalf of the Government of Canada, is delivering the Canada 150 Community Infrastructure Program in Western Canada. The investments support projects that renovate, expand and improve existing community infrastructure, with a focus on recreational facilities, projects that advance a clean growth economy, and projects with a positive impact on Indigenous communities. |
| Results achieved |
Western Economic Diversification Canada (WD) has developed a Performance Measurement Strategy that includes performance indicators, expected results, data sources to capture results achieved under the Department's Program Alignment Architecture. Key results include:
|
| Comments on variances | Actual spending is higher than planned spending by $12.3 million as a result of additional funds received for the delivery of Canada 150 Infrastructure Program. |
| Audits completed or planned | WD's internal audit function has been transferred to the OCG. All audits of the RDAs, including WD, will be conducted by OCG in accordance with their RDA RBAP. |
| Evaluations completed or planned | Not applicable |
| Engagement of applicants and recipients | The Canada 150 Community Infrastructure program is delivered through a call for proposals process. Potential applicants and stakeholders are engaged through active outreach, media strategies and information provided on Western Economic Diversification Canada's (WD) public website. |
Program: Program: Community Economic Growth (C150)
| Type of Transfer Payment | 2014–15 Actual spending |
2015–16 Actual spending |
2016–17 Planned spending |
2016–17 Total authorities available for use |
2016–17 Actual spending (authorities used) |
Variance (2016–17 actual minus 2016–17 planned) |
|---|---|---|---|---|---|---|
| Total grants | 0 | 0 | 0 | 0 | 0 | 0 |
| Total contributions | 0 | 0 | 23,100,000 | 46,200,000 | 35,426,022 | 12,326,022 |
| Total other types of transfer payments | 0 | 0 | 0 | 0 | 0 | 0 |
| Total Community Economic Growth | 0 | 0 | 23,100,000 | 46,200,000 | 35,426,022 | 12,326,022 |
| Type of Transfer Payment | 2014–15 Actual spending |
2015–16 Actual spending |
2016–17 Planned spending |
2016–17 Total authorities available for use |
2016–17 Actual spending (authorities used) |
Variance (2016–17 actual minus 2016–17 planned) |
|---|---|---|---|---|---|---|
| Total grants | 0 | 0 | 0 | 0 | 0 | 0 |
| Total contributions | 0 | 0 | 23,100,000 | 46,200,000 | 35,426,022 | 12,326,022 |
| Total other types of transfer payments | 0 | 0 | 0 | 0 | 0 | 0 |
| Total Canada 150 Community Infrastructure program | 0 | 0 | 23,100,000 | 46,200,000 | 35,426,022 | 12,326,022 |
Internal Audits and Evaluations
A Service Level Agreement has been established between the Internal Audit Sector of the Office of the Comptroller General of Canada (OCG) and the federal Regional Development Agencies (RDAs), including WD. This agreement became effective April 1, 2012, and details the provision of internal audit services by the OCG to the RDAs. A three-year Risk-Based Audit Plan was approved in November 2014, outlining planned audit engagements until 2016-17.
During 2016-17, none of the audits that were conducted by OCG included WD.
| Title of internal audit | Internal audit type | Completion date |
|---|---|---|
| N/A | N/A | N/A |
| Title of the evaluation | Status | Deputy head approval Date | Link to organization’s program(s) |
|---|---|---|---|
| Evaluation of Innovation Programming | In progress | September 2017 (expected approval date) |
Business Development and Innovation |
Response to Parliamentary Committees
| Response to Parliamentary Committees |
|---|
|
Standing Committee on Industry, Science and Technology – 42-1 - Meeting #9 Discussion: Pursuant to Standing Order 108(2) and the motion adopted by the Committee on February 23, 2016, the Committee resumed an Overview of the Organizations under Innovation, Science and Economic Development Canada. Follow up: There were no recommendations made for Western Economic Diversification Canada. |
Up-Front Multi-year Funding
| Name of recipient |
Primrose Lake Economic Development Corporation (PLEDCO) URL to recipient's website: www.pledco.ca |
|---|---|
| Start date | March 30, 2007 |
| End date | March 30, 2027 |
| Strategic Outcome | A growing and diversified western Canadian economy. |
| Link to department's Program Alignment Architecture | Program 1.2: Community Economic Growth Sub-Program 1.2.2: Community Development |
| Description | Create a community controlled trust fund for economic development |
| Comments on variances | Not applicable |
| Significant audit findings by the recipient during the reporting year, and future plan | No audits performed to date. Date for an audit in the future has not yet been identified. |
| Significant evaluation findings by the recipient during the reporting year, and future plan | An evaluation is expected to be completed by PLEDCO in 2017-18. |
| Summary of results achieved by the recipient | During fiscal 2016-17, the Board reviewed and updated their Strategic Plan to 2019. PLEDCO formed strategic partnerships with other groups and invested in regional projects in tourism, fishing, forestry, and oil and gas, which may impact future years. Since 2014, PLEDCO has provided a loan fund to assist with the start-up/development costs for primary producers in the PLEDCO communities of Beauval, Ile-a-la-Crosse, Cole Bay, and Jans Bay. Primary producers are residents of communities who are involved in the commercial fishing, wild rice production or trapping industry. PLEDCO continues to distribute funds based on new applications from the communities. Financial Statements are pending for 2016-17. Total funding: $15,000,000 |
| 2014–15 Actual spending |
2015-16 Actual spending |
2016–17 Planned spending |
2016–17 Total authorities available for use |
2016–17 Actual spending (authorities used) |
Variance (2016–17 actual minus 2016–17 planned) |
|---|---|---|---|---|---|
| $0 | $0 | $0 | $0 | $0 | $0 |
User Fees, Regulatory Charges and External Fees
Reporting on the User Fees Act
General and Financial Information by Fee
General Information
| Fee name | Fees for the processing requests filed under the Access to Information Act |
|---|---|
| Fee type | Other products and services |
| Fee-setting authority | Access to Information Act |
| Year introduced | 1985 |
| Year last amended | 1992 |
| Performance standard |
A response is provided within 30 days following receipt of request; the response time may be extended pursuant to section 9 of the Access to Information Act .
|
| Performance results | Western Economic Diversification Canada received only two new requests, and carried forwarded one request from 2014-2015. The Department responded within 30 days on one request. *The remaining two requests were completed within 31 to 70 days. |
| Other information |
Under the Access to Information Act , fees under $25 may be waived when deemed to be in the public interest. Fees waived during 2015–16 were $19.
|
* Includes cases where a Notice of Extension is sent to the requester within 30 days of receipt of the request.
| Forecast revenue | Actual revenue | Full cost |
|---|---|---|
| 250 | 10 | 10 |
| Planning year | Forecast revenue | Estimated full cost |
|---|---|---|
| 2016–17 | 250 | 250 |
| 2017–18 | 250 | 250 |
| 2018–19 | 250 | 250 |
Performance Measurement Framework Methodologies
| Type Selection | Expected Result | Performance Indicator | Definition of Performance Indicator | Data Source | Frequency of Data Collection |
|---|---|---|---|---|---|
| Program Level | |||||
| 1.0 Business Development & Innovation | |||||
| Expected Result | Western Canadian SMEs are engaged in international business | $ value and type of international business activity facilitated by WD |
“Type” is defined as:
|
WD's Information Management System - Gateway | Semi-annually, minimum |
| Expected Result | Western Canadian SMEs are competitive | # of SMEs that increase gross margins | The number of companies that increase their gross margin following participation in a project. "Gross margin" is defined as gross income (sales less production costs) divided by sales, expressed as a percentage. Gross margin is a measure of how efficiently a company uses its resources. | WD's Information Management System - Gateway | Semi-annually, minimum |
| Expected Result | Western Canadian SMEs are innovative | # of instances and type of protection of intellectual property exercised | Type is defined as: 1) patents; 2) industrial design; 3) integrated circuit topography; 4) copyrights; and 5) trademarks. These categories are based upon the Intellectual Property categories covered by the Canadian Intellectual Property Office. | WD's Information Management System - Gateway | Semi-annually, minimum |
|
Sub-Program Level |
|||||
|
1.1 Trade, Investment & Market Access |
|||||
| Expected Result | Capacity of western clients to pursue international business opportunities or attract international visitors | # of western SMEs and other organizations pursuing a trade, investment, international R&D or tourism opportunity, as a result of global advisory and market access services | This indicator is focused on capacity building with clients who typically have very little international business experience. "Opportunity" refers to a prospect where there is some possibility of a future sale, investment or partnership; an "opportunity" is at an earlier stage in the international business engagement process than a "business lead." | WD's Information Management System - Gateway | Semi-annually, minimum |
| Expected Result | Capacity to support the flow of goods and services in and out of Western Canada | $ value and type of improvements to trade infrastructure |
“Type” is defined as:
|
WD's Information Management System - Gateway | Semi-annually, minimum |
| Expected Result | International awareness of trade, investment, and tourism opportunities, and SME technology capabilities in Western Canada | $ value and type of international business leads generated through missions, events, and marketing initiatives |
This indicator is focused on enhancing capacity of clients who typically already have some international business experience. "Business leads" refers to a solid prospect with a foreign company or organization with a reasonable possibility of an international sale, investment, or R&D partnership; a "business lead" is at a later stage in the international business engagement process than an "opportunity". "Type" includes:
|
WD's Information Management System - Gateway | Semi-annually, minimum |
|
1.2 Business Productivity and Growth |
|||||
| Expected Result | Access to business development services, capital, and leveraged capital | # of businesses created, maintained, or expanded through business or capital services | The number of businesses created, maintained or expanded through business development or capital services. The number of loans provided is equivalent to the number of businesses created, maintained, or expanded. “Type of services” includes: 1) business development services; and 2) capital services. | WD's Information Management System - Gateway | Semi-annually, minimum |
| Expected Result | Adoption of sound management and business practices, and technology | # of SMEs investing in adoption of sound management or business practices, or technology | Number of SMEs investing in the adoption of sound management or business practices, or technology, as a result of the project. | WD's Information Management System - Gateway | Semi-annually, minimum |
| Expected Result | Access to skilled labour | # of skilled workers hired as a result of training or skills certification | The number of skilled workers hired in their skill area as a result of training or skills certification funded by the project. | WD's Information Management System - Gateway | Semi-annually, minimum |
|
1.3 Innovation Capacity Building |
|||||
| Expected Result | Initial Technology Development - Basic technological components are integrated for testing and validation in a simulated (laboratory) environment. | $ value of applied R&D undertaken related to initial technology development | This is an annual reporting of the monetary value of the R&D, based upon costs incurred. If the project involves reimbursement of operating costs only, count the value of all R&D costs throughout the funding period. If the project involves capital costs, count the value of all R&D costs undertaken in the facility following completion of the building or equipment set-up. | WD's Information Management System - Gateway | Semi-annually, minimum |
| Expected Result | Intermediate Technology Development - Prototypes are ready for demonstration in an operational setting | # of prototypes ready for demonstration in operational environment | Prototype at planned operational level and is ready for demonstration in an operational environment. Activities include prototype field testing. | WD's Information Management System - Gateway | Semi-annually, minimum |
| Expected Result | HQP - Create a pool of highly qualified personnel to support the commercialization of knowledge-based products, processes, and services | # of HQP trained | The number of skilled personnel (engineers, scientists, and people with science and specialized business skills related to technology commercialization) who receive training through the project. | WD's Information Management System - Gateway | Semi-annually, minimum |
|
1.4 Technology Commercialization |
|||||
| Expected Result | Advanced Technology Development - The technology in its final form is proven through successful deployment in an operational setting under real-life conditions | # of products, processes or services, proven through successful deployment in an operational setting | Actual application of the technology in its final form and under real-life conditions, such as those encountered in operational tests and evaluations. Activities include using the innovation under operational conditions (Level 9). | WD's Information Management System - Gateway | Semi-annually, minimum |
| Expected Result | SMEs have enhanced financial capacity to pursue technology development and commercialization | $ value of incremental private sector investment attracted | Amount of any private sector capital invested in a spin-off company (for WINN the proponent is the spin-off company) as a result of the project. Does not include private sources of project funding outlined at the time of approval. | WD's Information Management System - Gateway | Semi-annually, minimum |
| Expected Result | SMEs have enhanced sales of knowledge-based products, processes, and/or services | $ value of sales tied to the knowledge-based product, process, service, or technology commercialized | The dollar value of total sales (domestic and international) of the product, process, service, or technology supported through WD funding. | WD's Information Management System - Gateway | Semi-annually, minimum |
|
Program Level |
|||||
|
2.0 Community Economic Growth |
|||||
| Expected Result | Western Canadian communities have strong businesses | SME sales growth ($) | Growth in sales (dollar value) of assisted clients over the reporting period (e.g. dollar change in sales from 2013-2016). For the CF Program, loan client results will be compared to a control group. | Statistics Canada Data | Annually |
| Expected Result | Western Canadian communities have the capacity for socio-economic development | # of communities benefitting from Community Economic Growth projects | "Communities benefitting" include all distinct communities receiving benefit from a community-based project under one of the following three sub-programs: Community Development, Community Futures Program, or Targeted Economic Initiatives. Note: If a community benefits from two different projects, that community will be counted twice. | WD's Information Management System - Gateway & Client Relationship Management (CRM) | Semi-annually, minimum |
| Expected Result | Western Canadian communities have the necessary public infrastructure to support economic growth | # of communities benefitting from federal public infrastructure investments | "Communities benefitting" include all distinct communities receiving benefit from a new or improved infrastructure system, network, or facility. Note: If a community benefits from two different projects, that community will be counted twice. | WD's Information Management System - Gateway | Semi-annually, minimum |
|
Sub-Program Level |
|||||
|
2.1 Infrastructure Programming |
|||||
| Expected Result | New or improved environmental systems | # and type of new or improved environmental systems | “Type” refers to water, wastewater, solid waste, energy efficiency, and brown field remediation. | WD's Information Management System - Gateway | Semi-annually, minimum |
| Expected Result | New or improved transportation or telecommunications networks |
# and type of new or improved transportation or telecommunications networks | “Type” refers to local transportation, public transit, and public internet access. | WD's Information Management System - Gateway | Semi-annually, minimum |
| Expected Result | New or improved community, cultural, recreational, tourism, or other related facilities |
# and type of new or improved community, cultural, recreational, tourism, or other related facilities | “Type” refers to community, cultural, recreational, tourism, and other. | WD's Information Management System - Gateway | Semi-annually, minimum |
|
2.2 Community Development |
|||||
| Expected Result | Strong community strategic planning | # of local and regionally-based community strategic plan(s) developed and/or updated |
The Recipient has collaborated to develop and/or update a community strategic plan or plans which:
|
WD's Information Management System - Gateway and CRM | Semi-annually, minimum |
| Expected Result | Effective implementation of community plans | $ value and type of community-based projects |
"Value" represents the total costs of the community-based project, including both WD's or the FEDO's contribution as well as funding leveraged from other sources. “Type” includes:
|
WD's Information Management System - Gateway and CRM | Semi-annually, minimum |
|
2.3 Community Futures Program |
|||||
| Expected Result | Strong rural community strategic planning and implementation | $ value and type of community-based projects | "Value" represents the total costs of the community-based project, including both CF Program funding as well as funding leveraged from other sources. The amount of funding originating from the CF Program Authority will be reported separately. “Type” includes: 1. Development of knowledge and/or tools to diversify the local economy; 2. Labour market skills development; 3. Capacity building of community organizations; 4. Enhanced services and infrastructure; and, 5. Promotion of entrepreneurship/ business development (includes business skills development). |
WD's Information Management System - CRM | Semi-annually, minimum |
| Expected Result | Rural access to business development services | # of businesses created, maintained, or expanded through business services | The number of businesses created, maintained or expanded through business development services. | WD's Information Management System - CRM | Semi-annually, minimum |
| Expected Result | Rural access to capital and leveraged capital | $ value and type of loan | Dollar value of loans to new and existing business, where approved and first disbursement made by CF Organization. “Type” includes: 1) loans to new businesses and 2) loans to existing businesses. | WD's Information Management System - CRM | Semi-annually, minimum |
|
2.4 Targeted Economic Initiatives |
|||||
| Expected Result | Business opportunities are created | # of businesses created, maintained, or expanded | The number of businesses created, maintained, or expanded through targeted economic initiatives. | WD's Information Management System - Gateway | Semi-annually, minimum |
| Expected Result | Community opportunities are created | $ value and type of community-based projects |
"Value" represents the total costs of the community-based project, including both WD's contribution as well as funding leveraged from other sources. “Type” includes:
|
WD's Information Management System - Gateway | Semi-annually, minimum |
| Expected Result | Job opportunities are created | # of person months of employment created, maintained, or expanded | The number of person months of employment created, maintained or expanded as a result of targeted economic initiatives. Expanded refers to transitioning a seasonal or part-time employee to a year-round or full-time position, or similar increase in hours. One job = 12 person months of employment. (For public reporting, person months of employment will be converted to jobs.) | WD's Information Management System - Gateway | Semi-annually, minimum |
| Program Level | |||||
| 3.0 Policy, Advocacy, and Coordination | |||||
| Expected Result | Policies that strengthen the western Canadian economy | Percentage of key Informants with the opinion that WD activities resulted in policies that support the economic development of Western Canada | The survey will provide respondents with a 5-point scale from Strongly Agree to Strongly Disagree. Respondents who agree or strongly agree with the statement, will be counted among those "with the opinion that WD activities resulted in policies that support the economic development of Western Canada.” | Survey | Every 2.5 years |
| Expected Result | Programs that strengthen the western Canadian economy | Percentage of key Informants with the opinion that WD activities resulted in programs that support the economic development of Western Canada | The survey will provide respondents with a 5-point scale from Strongly Agree to Strongly Disagree. Respondents who agree or strongly agree with the statement, will be counted among those "with the opinion that WD activities resulted in programs that support the economic development of Western Canada.” | Survey | Every 2.5 years |
|
Sub-Program Level |
|||||
|
3.1 Advocacy & Coordination |
|||||
| Expected Result | Access to economic opportunities for Western Canada | # of initiatives WD engaged in to enhance access to economic development opportunities for Western Canada | "Initiatives" are defined as WD activities intended to influence federal policy, program and/ or project development. These initiatives may be categorized by WD policy priority area (e.g., Trade & Investment, Clean Energy & Oil Sands, SME Innovation or Other). | Regional PAC Indicator Tracking Document | Semi-annually |
| Expected Result | Coordinated economic development activities, policies, and programs in Western Canada | # of initiatives undertaken, programs implemented, and policies developed, which were coordinated by WD | "Initiatives" are defined as WD activities intended to provide leadership in coordinating economic development activities, policy development or implementation, or program development or implementation. | Regional PAC Indicator Tracking Document | Semi-annually |
| Expected Result | Access to procurement opportunities for western Canadian SME’s | # of initiatives WD engaged in to enhance access to procurement opportunities for western Canadian SMEs and stakeholders | "Initiatives" are defined as WD activities intended to represent western Canadian interests or facilitate business development opportunities related to procurement. | Regional PAC Indicator Tracking Document | Semi-annually |
|
3.2 Economic Analysis |
|||||
| Expected Result | Decisions impacting the western Canadian economy are informed by evidence- based economic analysis | # of evidence-based economic analyses conducted/ funded by WD | "Economic analysis" is defined as a final economic-oriented research product, either internally produced or funded through Grants and Contributions. | Regional PAC Indicator Tracking Document | Semi-annually |
- Date modified: